Examples
The machine-learned interatomic potential (MLIP) front end exists to give
you a usable phonon calculation without DFT: a structure file and
a choice of potential are enough to produce ENDF tapes, spectra, and
NCrystal data. It is meant as a starting point, in particular for users
who are not lattice-dynamics specialists.
The pretrained potentials differ from DFT, from each other, and from
experiment, and the size of those differences depends on the material.
This page shows three comparisons against independent references, with
the commands that produced them, so you can judge whether the accuracy is
sufficient for your application before investing in a full
material-specific evaluation. The structure files (and the ZrO2 Born
charges) ship with the repository under examples/mlip/, so every
build command below runs from a clone.
Two caveats apply to everything below. First, the rankings change from material to material; the potential that wins one comparison loses another, so treat every ranking here as a calibration point rather than a recommendation. Second, all calculations on this page use the potentials exactly as shipped. Nothing is fitted or adjusted.
Crystals against DFT
Four crystals have published or database DFT phonon references: fcc Ni (VASP, 4x4x4 supercell), graphite (published PBE calculation), wurtzite BeO (paper calculation, no NAC on either side), and monoclinic ZrO2 (the phonondb entry mp-2858, a Materials Project ID, computed with PBEsol; NAC on both sides). NAC is the non-analytical correction, the long-range dipole term that splits the LO and TO modes of polar crystals. Each MLIP build used the reference's cell, supercell, and mesh (the reciprocal-space sampling grid of the phonon calculation), for example:
irma mlip build examples/mlip/zro2_cell.vasp -o bundle_nequip --potential nequip \
    --supercell "3 2 2" --mesh "20 20 20" --born examples/mlip/zro2_BORN \
    --snap-symmetry --jobs 9
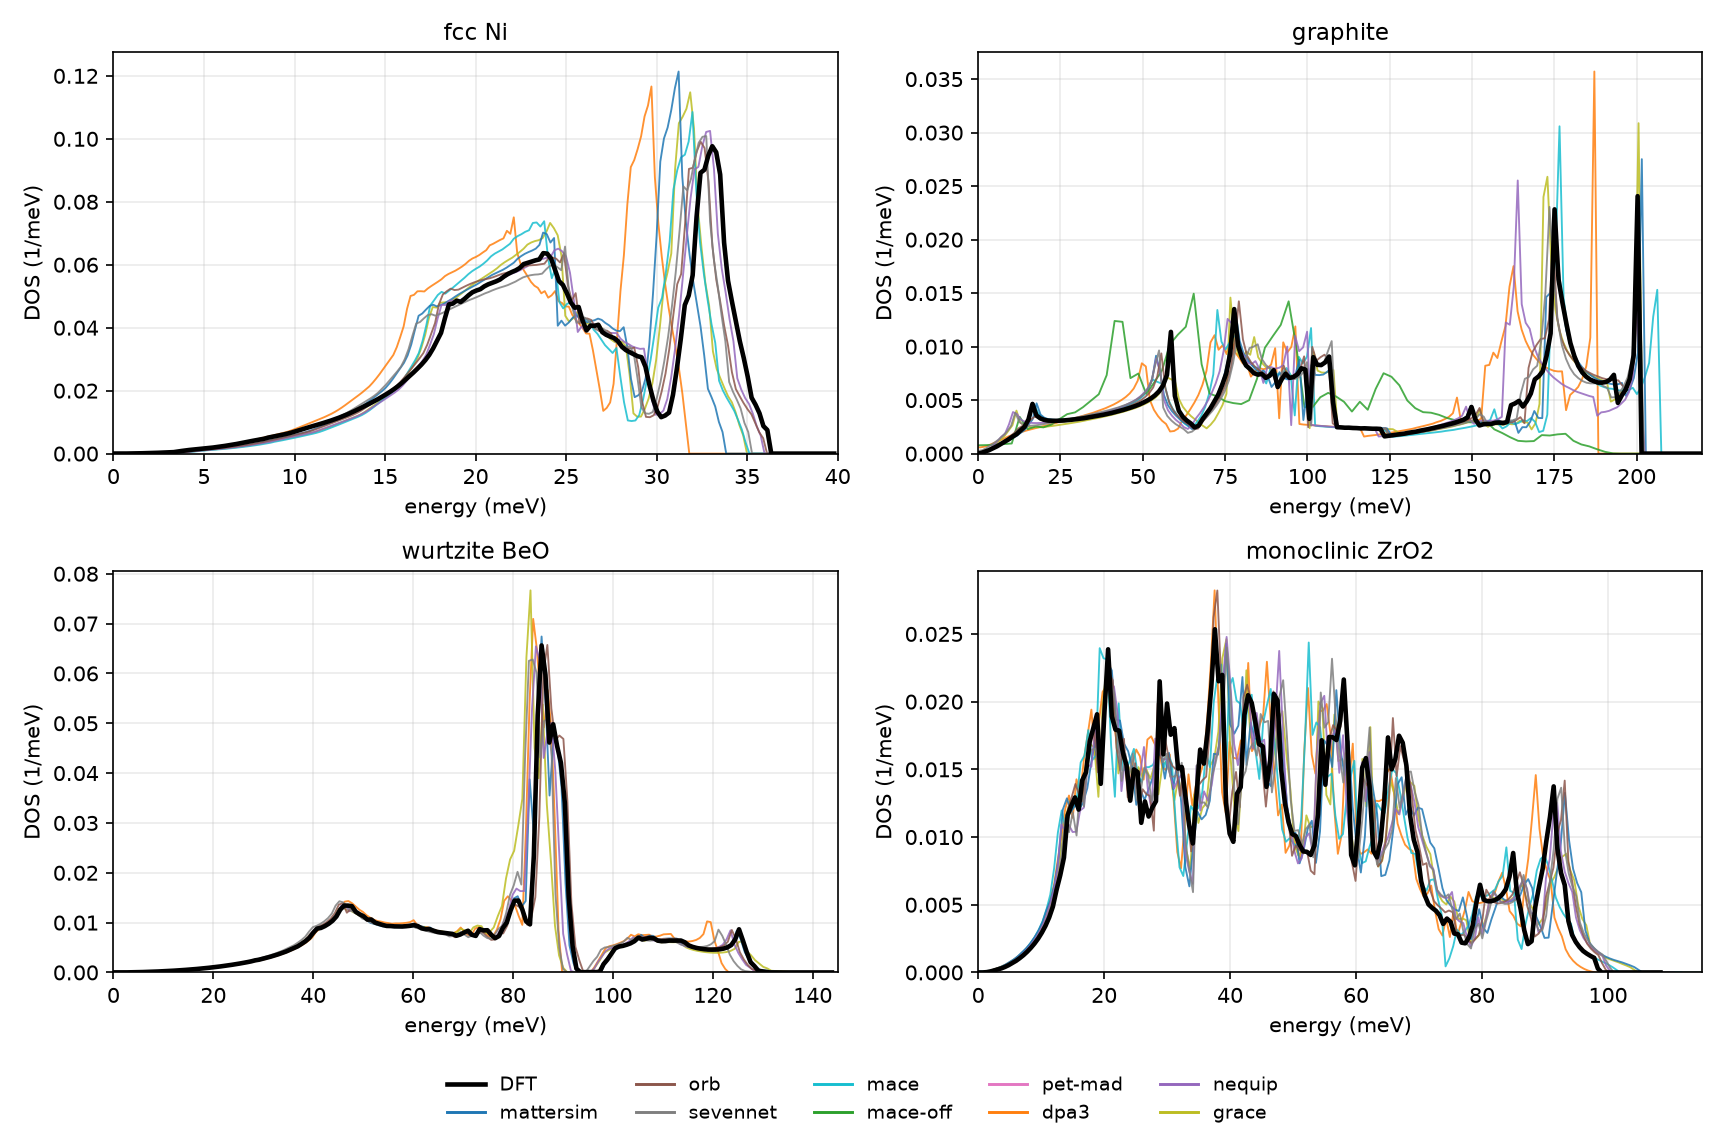
The spread across the nine potentials is the point of the first figure, which plots the total DOS for every potential against DFT. On BeO and ZrO2 the potentials track DFT closely, on Ni one potential (dpa3) puts the highest optical frequency 12.5% low, and on graphite the molecular potential mace-off fails broadly, because its training set contains no interlayer physics. That last curve is the clearest warning on this page: a potential applied outside its training domain does not degrade gracefully.
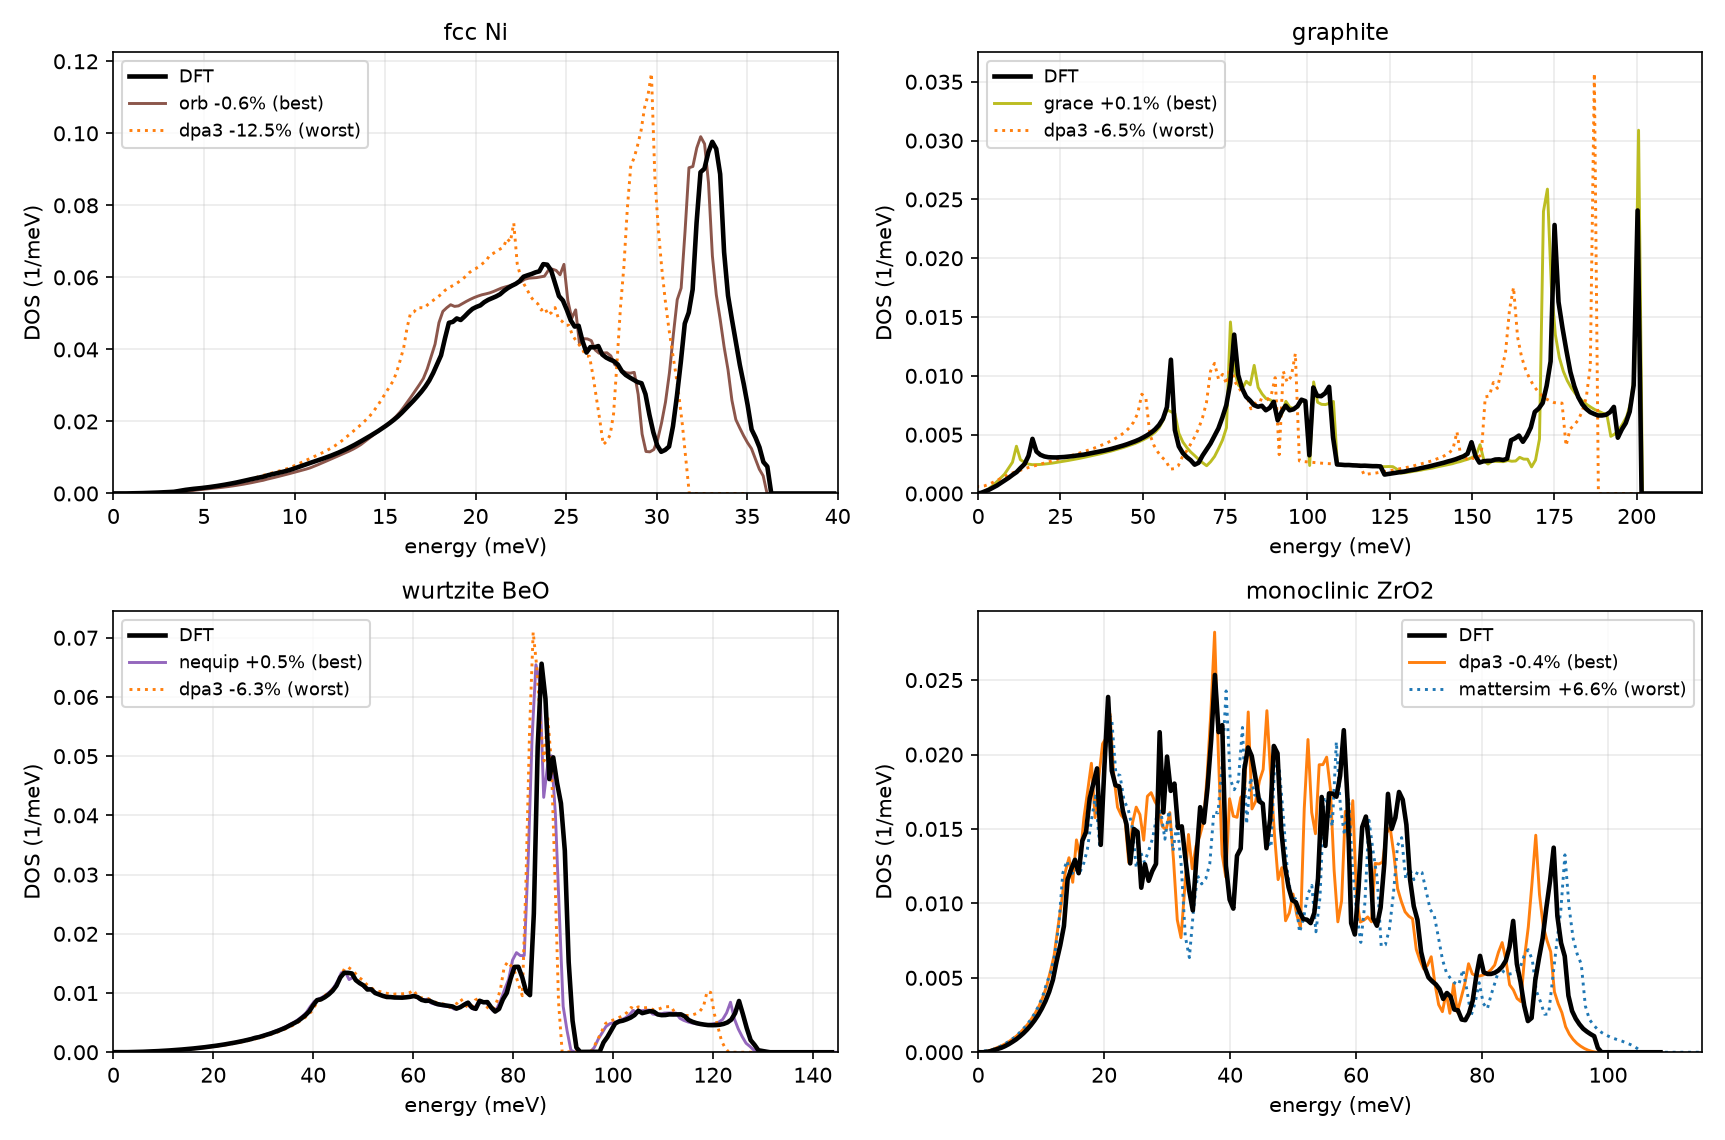
Isolating the best and worst potential per material, as the second figure does, makes the pattern easier to read: each panel is labeled with the deviation of the highest phonon frequency from DFT. dpa3 is the worst case on three of the four panels and the best case on ZrO2. The full deviation matrix:
| potential | Ni | graphite | BeO | ZrO2 |
|---|---|---|---|---|
| mattersim | -6.8 | +0.6 | +2.8 | +6.6 |
| orb | -0.6 | +0.2 | +3.3 | +1.3 |
| sevennet | -2.9 | +0.4 | -2.1 | +2.0 |
| mace | -3.3 | +2.9 | - | +3.0 |
| mace-off | - | -3.5 | - | - |
| pet-mad | -4.6 | +1.5 | +2.6 | +3.3 |
| dpa3 | -12.5 | -6.5 | -6.3 | -0.4 |
| nequip | -1.0 | +0.5 | +0.5 | +1.9 |
| grace | -3.7 | +0.1 | +4.6 | +5.9 |
Deviation of the highest phonon frequency from the DFT reference, in percent. Most entries sit within a few percent, and the outliers are not random: they follow training-set coverage. These numbers are best read against the practical alternative. When no phonon calculation is available for a material, whether from DFT or another atomistic method, thermal scattering evaluations have historically fallen back on analytic forms such as a Debye spectrum, which carry no material-specific structure. The potentials shown here generally provide a much more detailed and realistic starting point than such models.
Crystalline polyethylene against VISION
High-density polyethylene is a semicrystalline polymer (the calculation models its orthorhombic crystalline phase) with a spectrum measured on the VISION spectrometer at the Spallation Neutron Source, which makes it a direct test of the full chain from potential to instrument. The builds used the experimental orthorhombic cell and the same supercell as the DFT reference:
irma mlip build examples/mlip/pe_cell.vasp -o bundle_orb --potential orb \
    --supercell "2 3 6" --mesh "20 30 40" --snap-symmetry --jobs 9
irma mlip emit bundle_orb --to spectra
irma spectra run bundle_orb/spectra.yaml -o pe_vision.csv
irma mlip emit writes its own production-density phonon mesh into
spectra.yaml (int(98/a)+1 points per lattice axis, about 14×21×39 for
this cell), not the build's --mesh, which sets only the bundle's
quick-look DOS.
For the comparison below, the emitted spectra configuration was edited to the measurement conditions; the keys changed were:
physics:
  inelastic_mode: 1
material:
  temperature_K: 5.0
grid:
  e_max_meV: 1000.0
instrument:
  geometry: vision
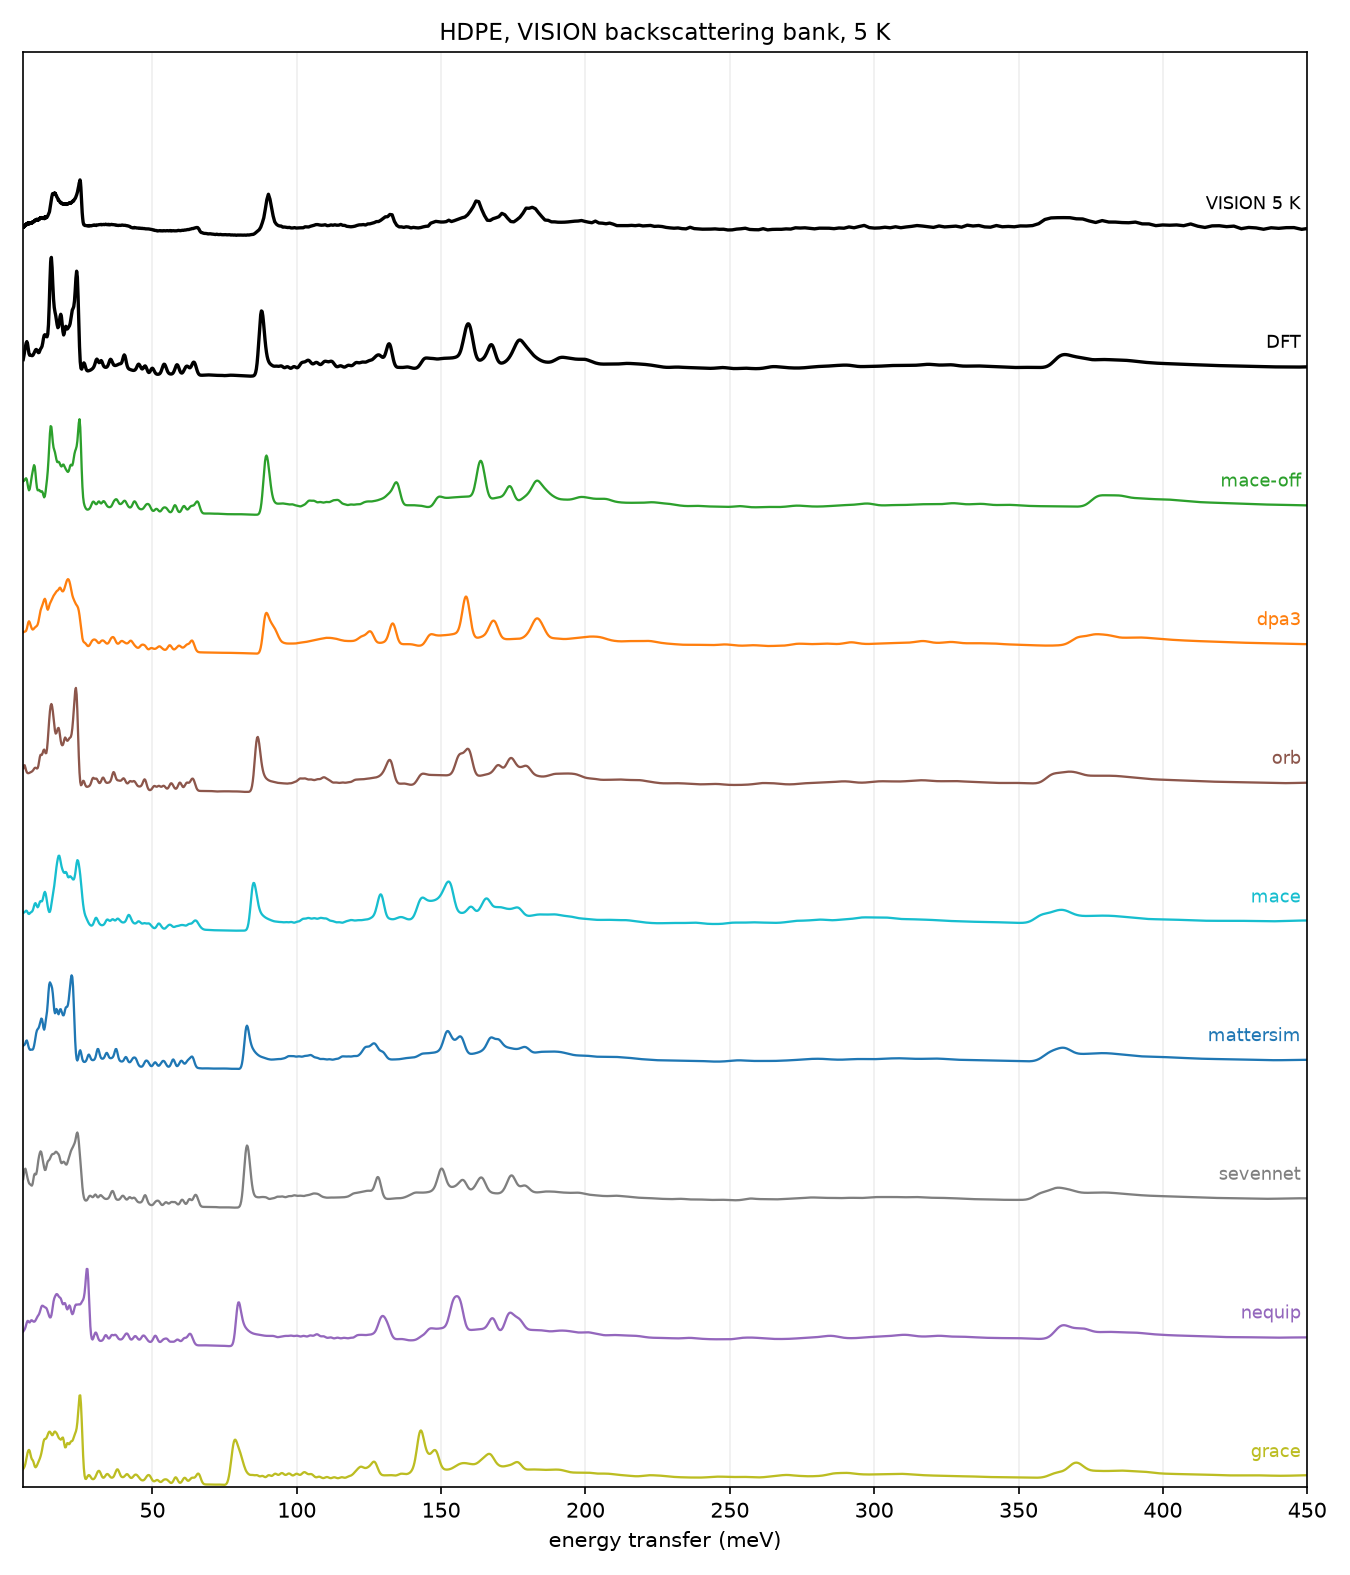
All eight potentials that completed appear in the stack with the measured spectrum and DFT (pet-mad could not relax this crystal below 0.02 eV/A and is absent), ordered by the accuracy of the CH2 rock peak at 90.2 meV. Scanning down the stack, the rock peak drifts away from the measured position, from within 1 meV (mace-off, dpa3) to 11 meV low (grace). The C-H stretch near 366 meV moves the other way: the potentials that place the rock well overshoot the stretch by 12-14 meV, and the potentials that place the stretch within 2 meV soften the rock by 5-10 meV. No potential gets both peaks right. DFT places both within 2.4 meV.
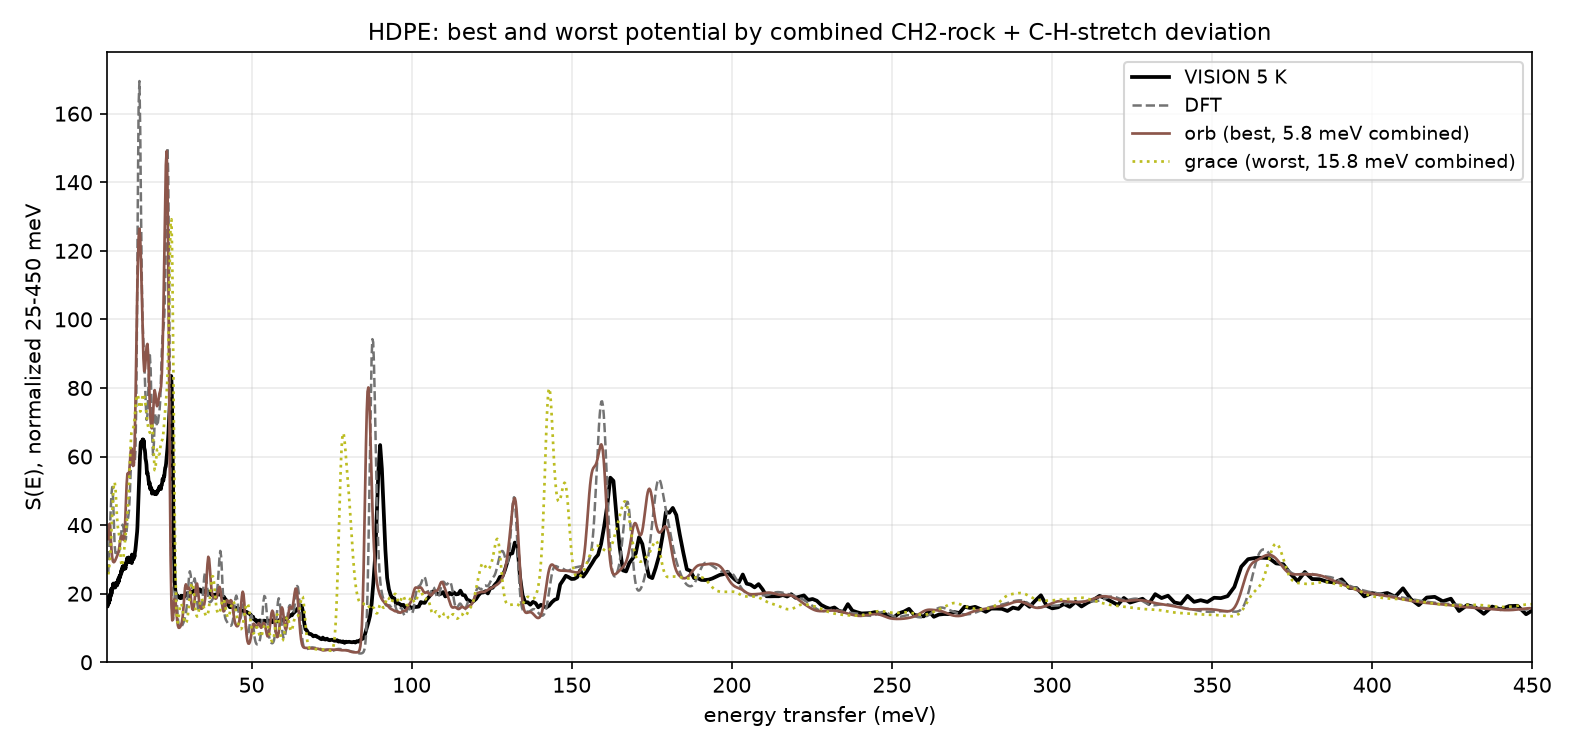
| model | CH2 rock (meV) | C-H stretch (meV) |
|---|---|---|
| measured | 90.2 | 365.6 |
| DFT | -2.4 | +0.4 |
| dpa3 | -0.7 | +11.6 |
| mace-off | -0.7 | +13.9 |
| orb | -3.7 | +2.1 |
| mace | -5.2 | -0.9 |
| mattersim | -7.4 | -0.4 |
| sevennet | -7.4 | -1.9 |
| nequip | -10.2 | +0.1 |
| grace | -11.4 | +4.4 |
Peak positions relative to the measurement. The best-balanced potentials are orb and mace; converged DFT beats every potential on both peaks at once.
Amorphous PMMA against VISION
PMMA (Plexiglas) exercises the disordered workflow. It is an amorphous polymer with no crystal unit cell, so the calculation uses a structure model: a 302-atom periodic cell of two atactic (stereochemically random) chains, built at the experimental density of 1.18 g/cm3 and relaxed with the potential. The build runs at the Gamma point only (a disordered box has no meaningful Brillouin-zone dispersion, so one q-point suffices), and the emitted spectra configuration drives the DOS-based forward model:
irma mlip build examples/mlip/pmma_glass.vasp -o bundle_mattersim --potential mattersim \
    --disordered --jobs 9 --fmax 0.05 --jitter-cycles 3
irma mlip emit bundle_mattersim --to spectra --allow-unstable
irma spectra run bundle_mattersim/spectra.yaml -o pmma_vision.csv
The loosened --fmax and the jitter cycles reflect a measured property
of current potentials on disordered structures: the reported forces stall near
0.01-0.05 eV/A at the energy minimum, so the default convergence gate
cannot be met (see Troubleshooting on the
MLIP page). A few
percent of residual imaginary modes at Gamma is normal for an amorphous
structure model, and --allow-unstable accepts them for emission.
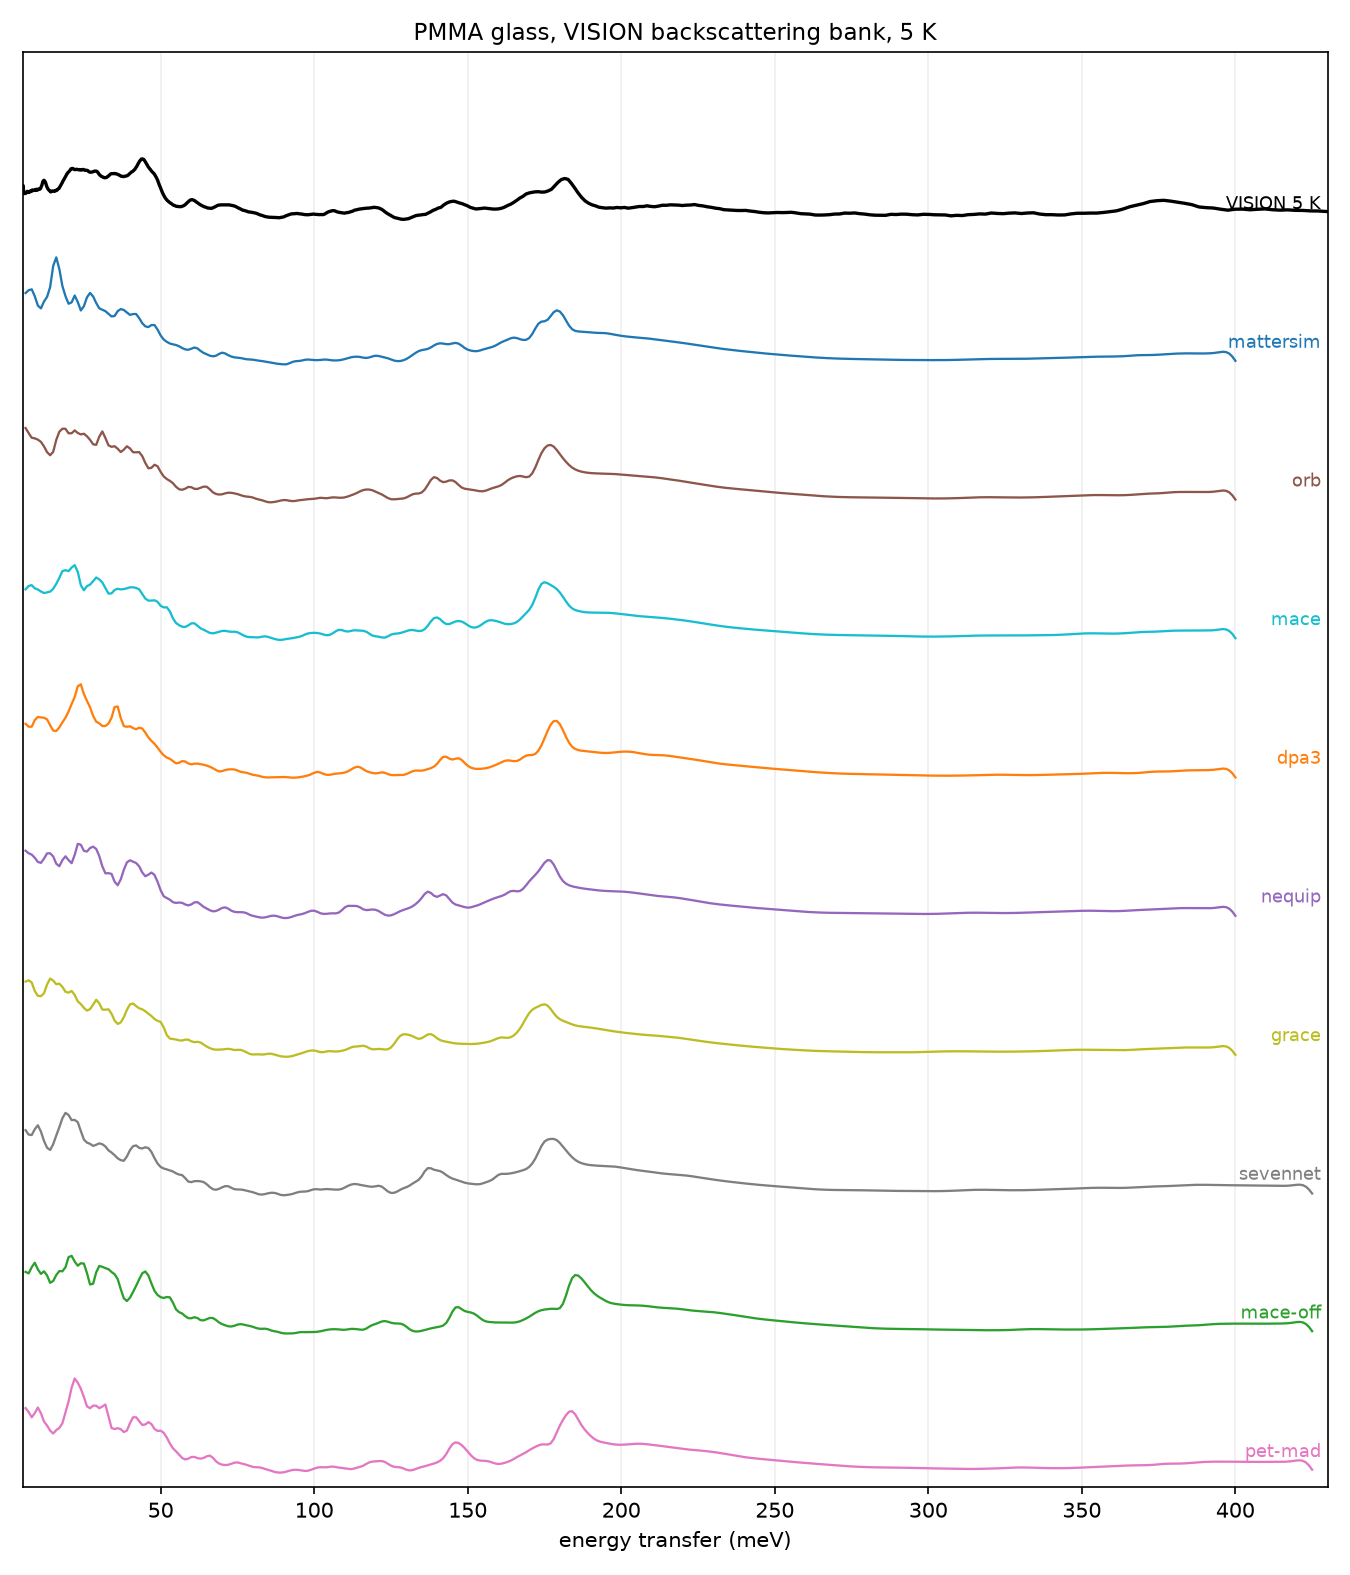
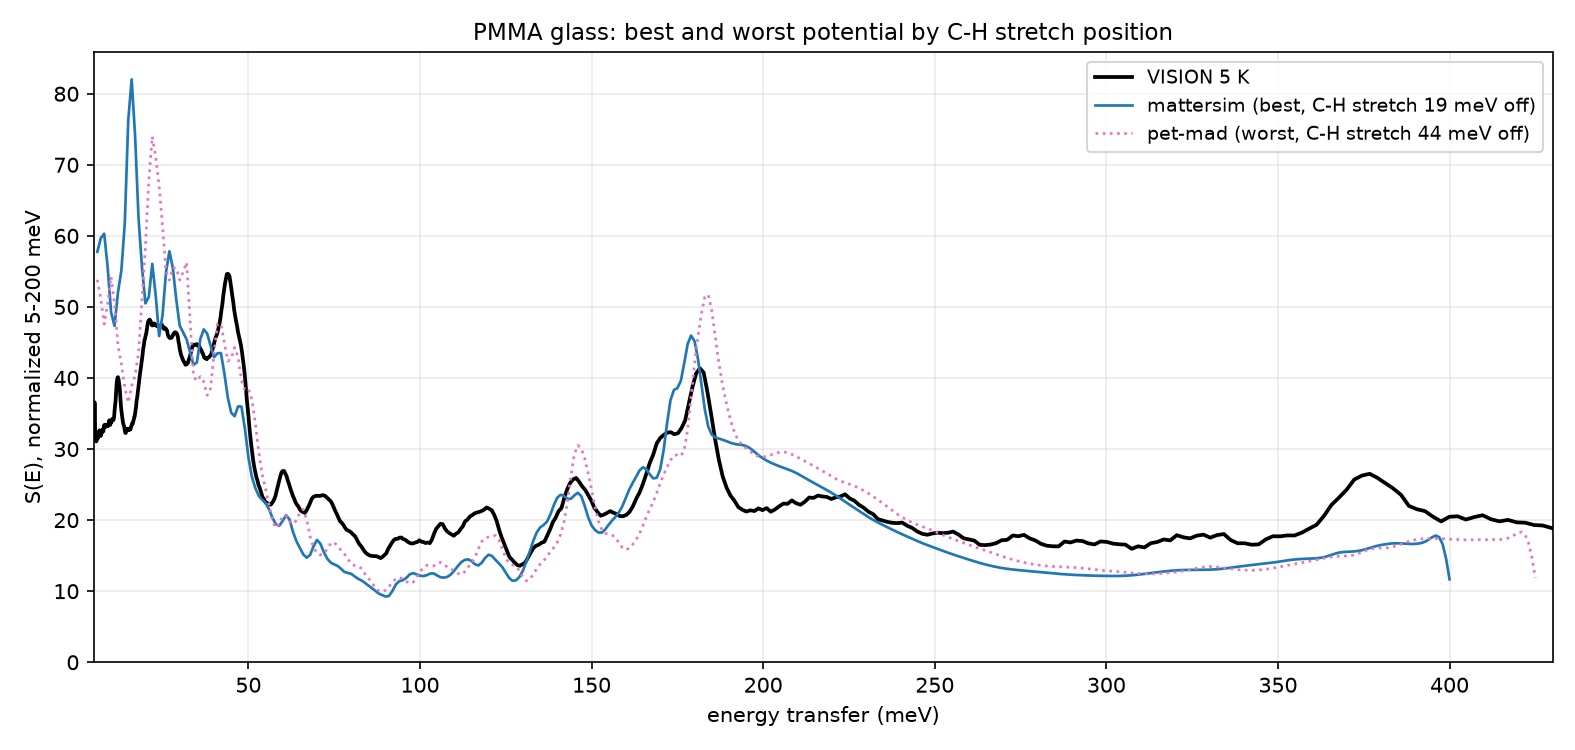
All nine potentials completed here; the stack orders them by the position of the C-H stretch peak. Below 200 meV the calculated spectra come out close to the measurement for most of the potentials without any adjustment: the torsion cluster at 15-50 meV, the 145 meV doublet, and the strong carbonyl/CH-bend peak at 181 meV are all present within a few meV. Three systematic discrepancies are visible in every curve. First, the C-H stretch, measured at 376.7 meV, computes 19-44 meV high; the smaller offsets (mattersim, nequip) are the usual harmonic overestimate (a harmonic calculation neglects the anharmonic softening of the stretch), and the larger ones are potential error on top of it. Second, the 250-350 meV plateau is under-predicted by every potential. Third, below 50 meV the details vary between realizations of the structure model, so differences there should not be over-read.